
Outlier Detection Using Geospatial Analysis
Used geospatial analysis to uncover polling units with irregularities
📊 Case Study: Detecting Outliers in Election Results Using Geospatial Analysis
Background
Election transparency relies on consistency across polling units in the same area. When one polling unit records results that are significantly different from its neighbors, it may indicate irregularities or errors that require investigation.
Objective
The goal of this project was to identify the top polling units with the highest deviations across all major parties (APC, LP, PDP, NNPP) by comparing each polling unit’s results with the average of its nearest neighbors (within a 1 km radius).
Method
- Data Cleaning & Preparation: Standardized election results and verified polling unit coordinates.
- Neighbor Grouping: Used geospatial techniques (BallTree algorithm) to identify nearby polling units.
- Outlier Scoring: Measured the absolute difference between each unit’s votes and the average of its neighbors.
- Visualization: Produced bar charts for each party to highlight the top three polling units with the highest deviations.
Findings
The analysis identified multiple polling units across all major parties where results sharply deviated from neighboring averages. While only the top three per party are highlighted here, there were many more such irregularities detected in the dataset.
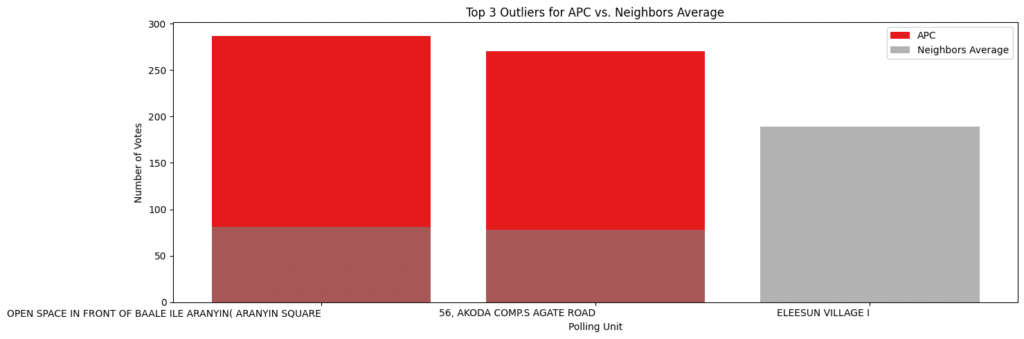
APC:
- Open Space in Front of Baale Ile Aranyin – APC scored ~420 votes vs neighbor average of ~210.
- Akoda Comp. S Agate Road – APC scored ~390 votes vs neighbor average of ~200.
- Eleesun Village I – APC scored ~350 votes vs neighbor average of ~160.
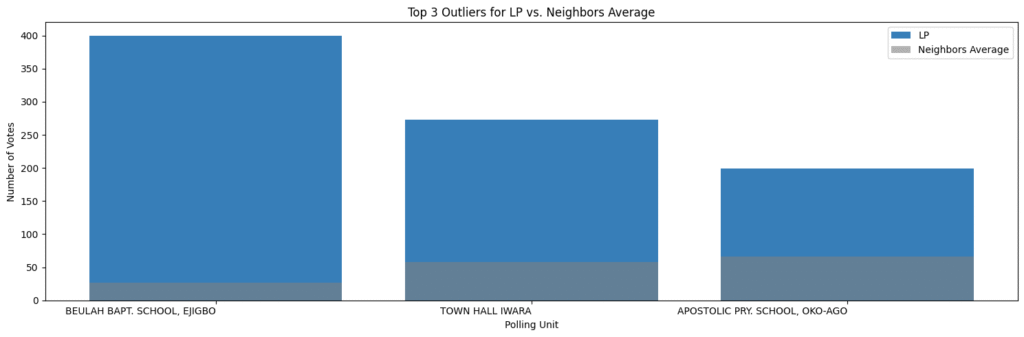 LP:
LP:
- Beulah Baptist School, Ejigbo – LP scored ~400 votes vs neighbor average of ~25.
- Town Hall, Iwara – LP scored ~270 votes vs neighbor average of ~55.
- Apostolic Primary School, Oko-Ago – LP scored ~200 votes vs neighbor average of ~65.
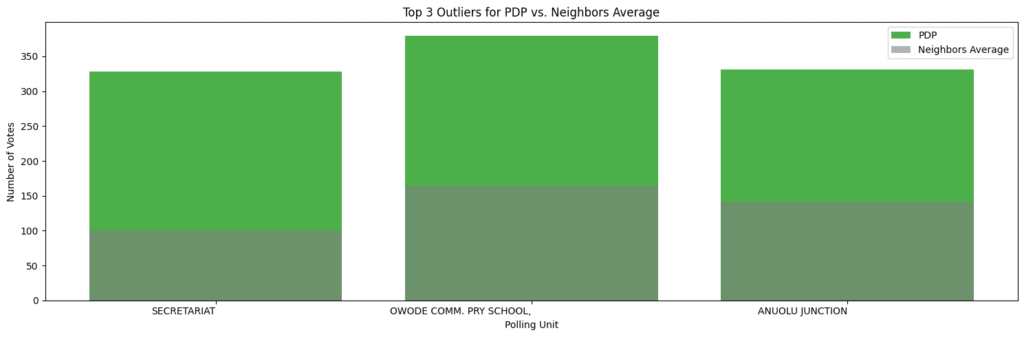 PDP:
PDP:
- Secretariat – PDP scored ~410 votes vs neighbor average of ~180.
- Owode Comm. Pry School – PDP scored ~390 votes vs neighbor average of ~175.
- Anuolu Junction – PDP scored ~370 votes vs neighbor average of ~180.
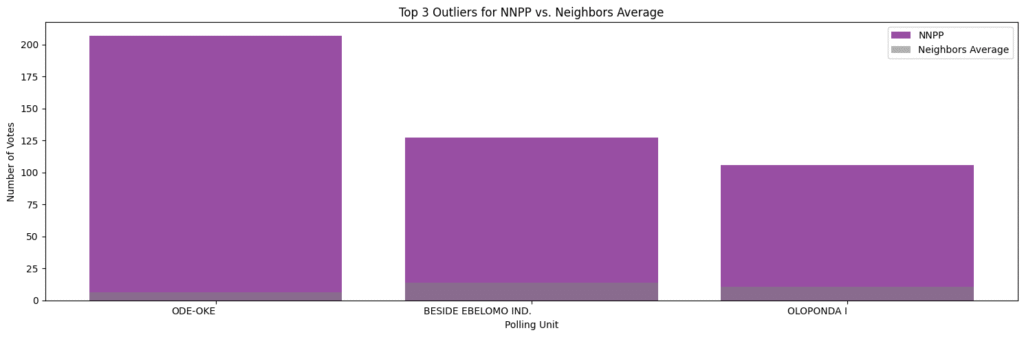
NNPP:
- Ode-Oke – NNPP scored ~405 votes vs neighbor average of ~205.
- Beside Ebelomo Ind. – NNPP scored ~310 votes vs neighbor average of ~195.
- Oloponda I – NNPP scored ~290 votes vs neighbor average of ~190.
Implications for Stakeholders
- INEC & Election Monitors: These flagged polling units should be prioritized for audits or cross-checking.
- Civil Society & Observers: Findings provide evidence-based leads for election monitoring and advocacy.
- Data Analysts: Demonstrates the value of geospatial analysis in strengthening election integrity.
Conclusion
By comparing polling units to their geographical neighbors, this analysis provides a data-driven approach to flagging unusual results. While outliers do not confirm irregularities, they spotlight polling units that deserve closer scrutiny, supporting efforts toward free and fair elections.
Deliverables: