VRSD Analysis
Used SQL to uncover customer trends, vehicle patterns, job performance, parts usage, and financial insights for better business decisions.
🚗 Case Study: Vehicle Repair Shop Data Analysis
📌 Objective
The goal of this project was to analyze customer behavior, vehicle patterns, job performance, parts usage, and financial metrics for a vehicle repair shop. Using SQL, I created queries that answered key business questions and revealed actionable insights for growth and efficiency.
🔧 Data Preparation
- Cleaned and standardized multiple CSV files.
- Ensured consistency in categorical data (e.g., vehicle makes).
- Indexed frequently queried columns for faster performance.
- Imported the data into a relational database.
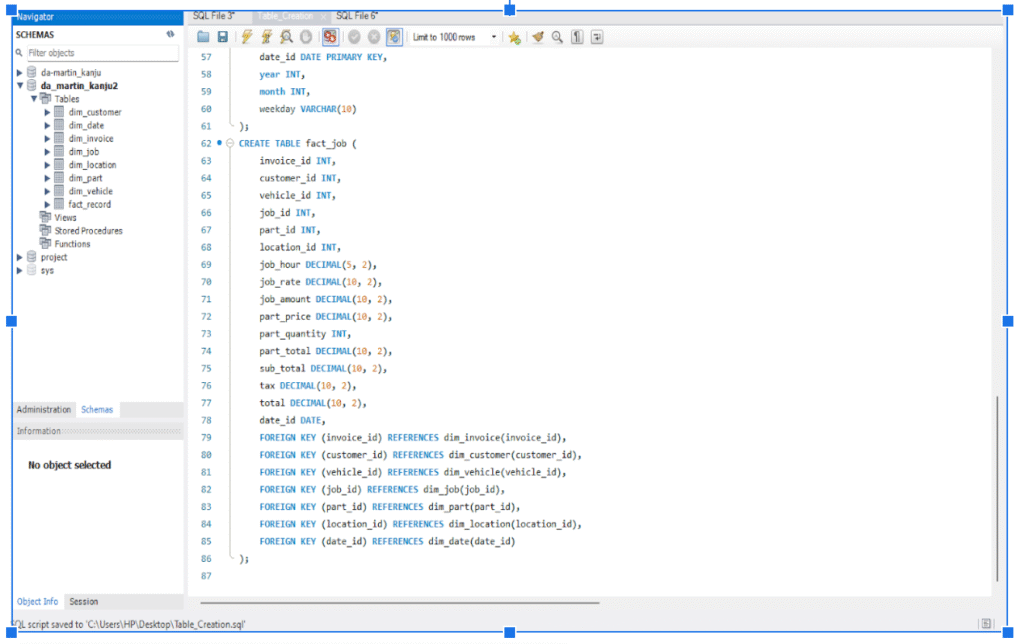
📂 SQL Files & Setup:
👥 Customer Analysis
SQL Techniques Used:
- Aggregation Queries (SUM, AVG) → to calculate spend and averages.
- Sorting & LIMIT → to find top 5 spenders.
- COUNT & GROUP BY → to track visit frequency.
Findings:
- Jennifer Robinson was the top spender ($1802.21).
- Average customer spend: $177.79.
- Repeat customers showed patterns in service frequency.
🚙 Vehicle Analysis
SQL Techniques Used:
- AVG() → to calculate vehicle mileage.
- GROUP BY + COUNT() → to find most common makes/models.
- CASE WHEN + GROUPING → to segment vehicles by age.
Findings:
- Average mileage: 33,699 miles.
- Common models: BMW X5, Toyota Corolla, Honda Civic.
- Older vehicles required more frequent major repairs.
🛠 Job Performance Analysis
SQL Techniques Used:
- JOINs → to connect jobs with revenue data.
- SUM() & GROUP BY → to calculate revenue by job type.
- ORDER BY + LIMIT → to find highest and lowest cost jobs.
Findings:
- High revenue jobs: Replace front CV Axel ($437.50) & Transmission check ($300.00).
- Underperforming services: Replace air filter.
🔩 Parts Usage Analysis
SQL Techniques Used:
- TOP N Queries (LIMIT) → to list most used parts.
- AVG() & SUM() → to calculate part costs and revenue.
Findings:
- Most used parts: CV Axel, Brake Pads, Battery.
- Average part cost highlighted stock planning needs.
💰 Financial Analysis
SQL Techniques Used:
- Date Functions (MONTH, YEAR) → to track monthly revenue.
- SUM() & CASE WHEN → to split labor vs. parts revenue.
- Profitability Calculation using revenue – costs.
Findings:
- Monthly revenue: $3954.86.
- Profitability: $2163.96.
- Sales tax had a measurable impact on net revenue.
📂 SQL Queries:
📊 Key Insights
- Top customers drive revenue—opportunity for loyalty programs.
- Stocking high-demand parts prevents delays.
- Bundling low-revenue jobs could increase sales.
- Prioritize scheduling high-profit jobs.
📝 Recommendations
- Launch a customer loyalty program for repeat spenders.
- Improve stock management of high-demand parts.
- Bundle low-revenue jobs to boost sales.
- Focus marketing on high-margin but low-frequency services.